The regular monitoring 4 days ago had REALLY high e-coli counts, so our wonderful LCRA contact Lisa joined us for a more involved e-coli sample. There were two main goals:
- verify our e-coli counts
- see if there is a source of pollution, such as the storm drain
To accomplish those goals, instead of sampling just one location, we sampled 4 places. But more on that in a minute.
We were shocked when we saw the stream. The change was amazing… and not for the better. The flow was very low, and the surface algae growth was incredible, especially immediately below the storm drain inflow. And our sample site – the pool below the crossing rocks – was covered with what appeared to be some sort of surfactant – scum. (For possible reasons for this scum, see the Biofoam post on the main CRWN blog. )
Why was the pond scum only at the pool below the crossing rocks? (We walked upstream roughly 100-150 ft and didn’t see any other “pond scum”.) One possibility is that it was the main place where the stream was mostly stagnant. And it is below the suspected source of the pollutants, the storm drain. Which leads us to the sample sites. Per Lisa, part of the goal was to take samples at suspected source pollutant sites and also at various types of flow (or no flow) – pool, riffle and runs, including at our usual sample site between the crossing rocks and the roughly meter deep pool where we get the water for the rest of the tests.
While taking the samples, we did observe minnows and water walkers.
Once we returned home, we started the “oven” to incubate the samples. While that warmed to 35 C, we added 1 ML of pond water to the EasyGel solutions and poured that into the petri dishes. Then we started the incubation and checked it the next evening (photos).
Lisa sent us her results, which were similar for 2 sites – and much higher for the other 2. We both took 2 samples; I’ve included the averages below from her spreadsheet. I’ve also uploaded her map with the sites marked (below). All counts are multiplied by 100 to obtain units of CFU/100 mL.
| site 1 | site 2 | site 3 | Site 4 | |
| Lisa | 2300 | 600 | 750 | >16500 |
| ours | 1450 | 750 | 800 | >6000 |
Site 1: Water sample taken directly from a ~0.4-m diameter storm drain culvert on north bank approximately 10 meters upstream of the bridge at Metric Blvd. Constant flow, actual water color clear, green algae abundant attached to substrate. Approximately 6 cm water depth.
Site 2: Upstream of site 1 (above culvert) in part-shade of tree branch reaching out over creek where small ripples emptied into small run. Approximately 20 meters upstream of bridge at Metric Blvd. Constant flow, abundant green attached algae to substrate. Approximately 6 cm water depth.
Site 3: Upstream of site 2, approximately 40 meters upstream of bridge at Metric Blvd. Run with 50-75% shade from trees above. Slow flow, but constant. Green algae common, attached to substrate with some in water column. Approximately 5.5 cm water depth.
Site 4: Approximately 15 meters downstream of bridge at Metric Blvd (regular/actual site sampled by monitors each month). Sample taken directly from small riffle right before flowing into large pool. Much foam present on top of water in pool, but not apparent in stretch above pool. Green algae attached to substrate and common. Approximately 6 cm water depth.
-
- sample #4 at usual sample site was VERY high >6000/ > 16500
-
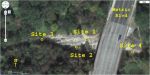
- ecoli sampling map with locations marked. #4 is by our usual sample site
-
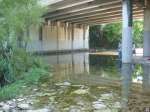
- view of under bridge from sample site – low water!
-
- Lisa carefully getting a water sample from the storm drain
-
- extensive algae by storm drain – an amazing difference from our recent visit
-
- algae near and above storm drain
-
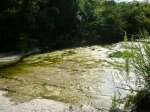
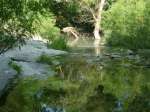
- the waterfall upstream of the bridge and storm drain is dry…
-
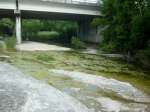
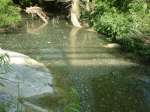
- view from the storm drain to the bridge – low water, much surface algae
-
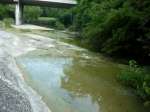
- another view downstream towards the bridge
-
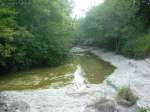
- from the storm drain looking upstream beyond the dry waterfall
-
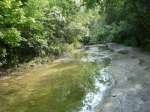
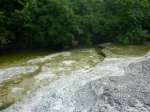
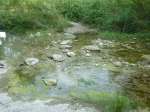
- farthest upstream, by site 3
-
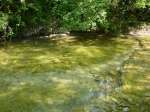
- a closeup near site 3 with much algae
-
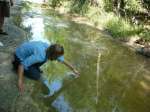
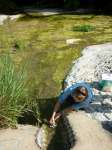
- Lisa collecting sample #3
-
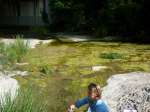
- view of the usual sample site and dry crossing rocks just upstream
-
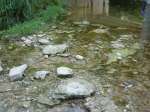
- another view of the dry crossing rocks (part of the hiking trail) & the algae
-
- a wider view of the crossing rocks
-
- the sample site with surfectant “pond scum” closeup – yuk!
-
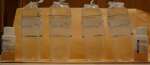
- getting ready to test the water – whirlpaks with easygel bottles (solution). We put 1 ML of the sample water in each bottle…
-
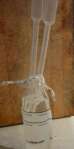
- pipettes used to remove the appropriate amount of pond water from each sample container
-
- after adding the 1 ML to the easygel solution, we placed that mixture in the “oven” for 24 hours.
-
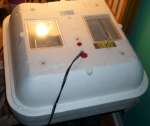
- …and started the incubation process
-
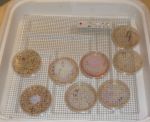
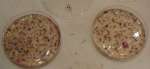
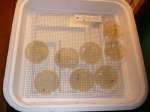
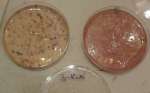
- e-coli samples after incubation (a couple have condensation on the lid)
-
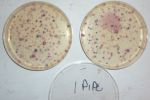
- results from the storm drain – 2300 / 1450
-
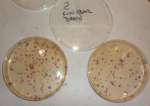
- #2 sample above storm drain – averages 600 & 750
-
- results of #3 samples above bridge and storm sewer – 750/800

Nice blog post! It seems that much of the “scum” in the pool below the bridge can partly be explained by the fluffy willow seeds that were falling from the tree over that part of the creek and sitting on top of the water. There is also a little bitty riffle above the pool that could be stirring up some biosurfactants or soap-derived surfactants in the water to produce foam.
By: Lisa Benton on June 28, 2010
at 4:13 PM